Performance Insights
Last updated: September 2, 2026
Overview
The Performance Insights page is your cross-location view into what Slang is accomplishing for you across multiple venues. In this article, we will go through what each metric entails, how you might utilize the analytics, and any notes regarding those metrics.
On Superhost, this page currently shows Call Volume, Answer Rate, Bookings, Cancellations, and Modifications. Other columns aren't available yet.
Note: Please ensure your view is filtered for the date range you'd like to see.
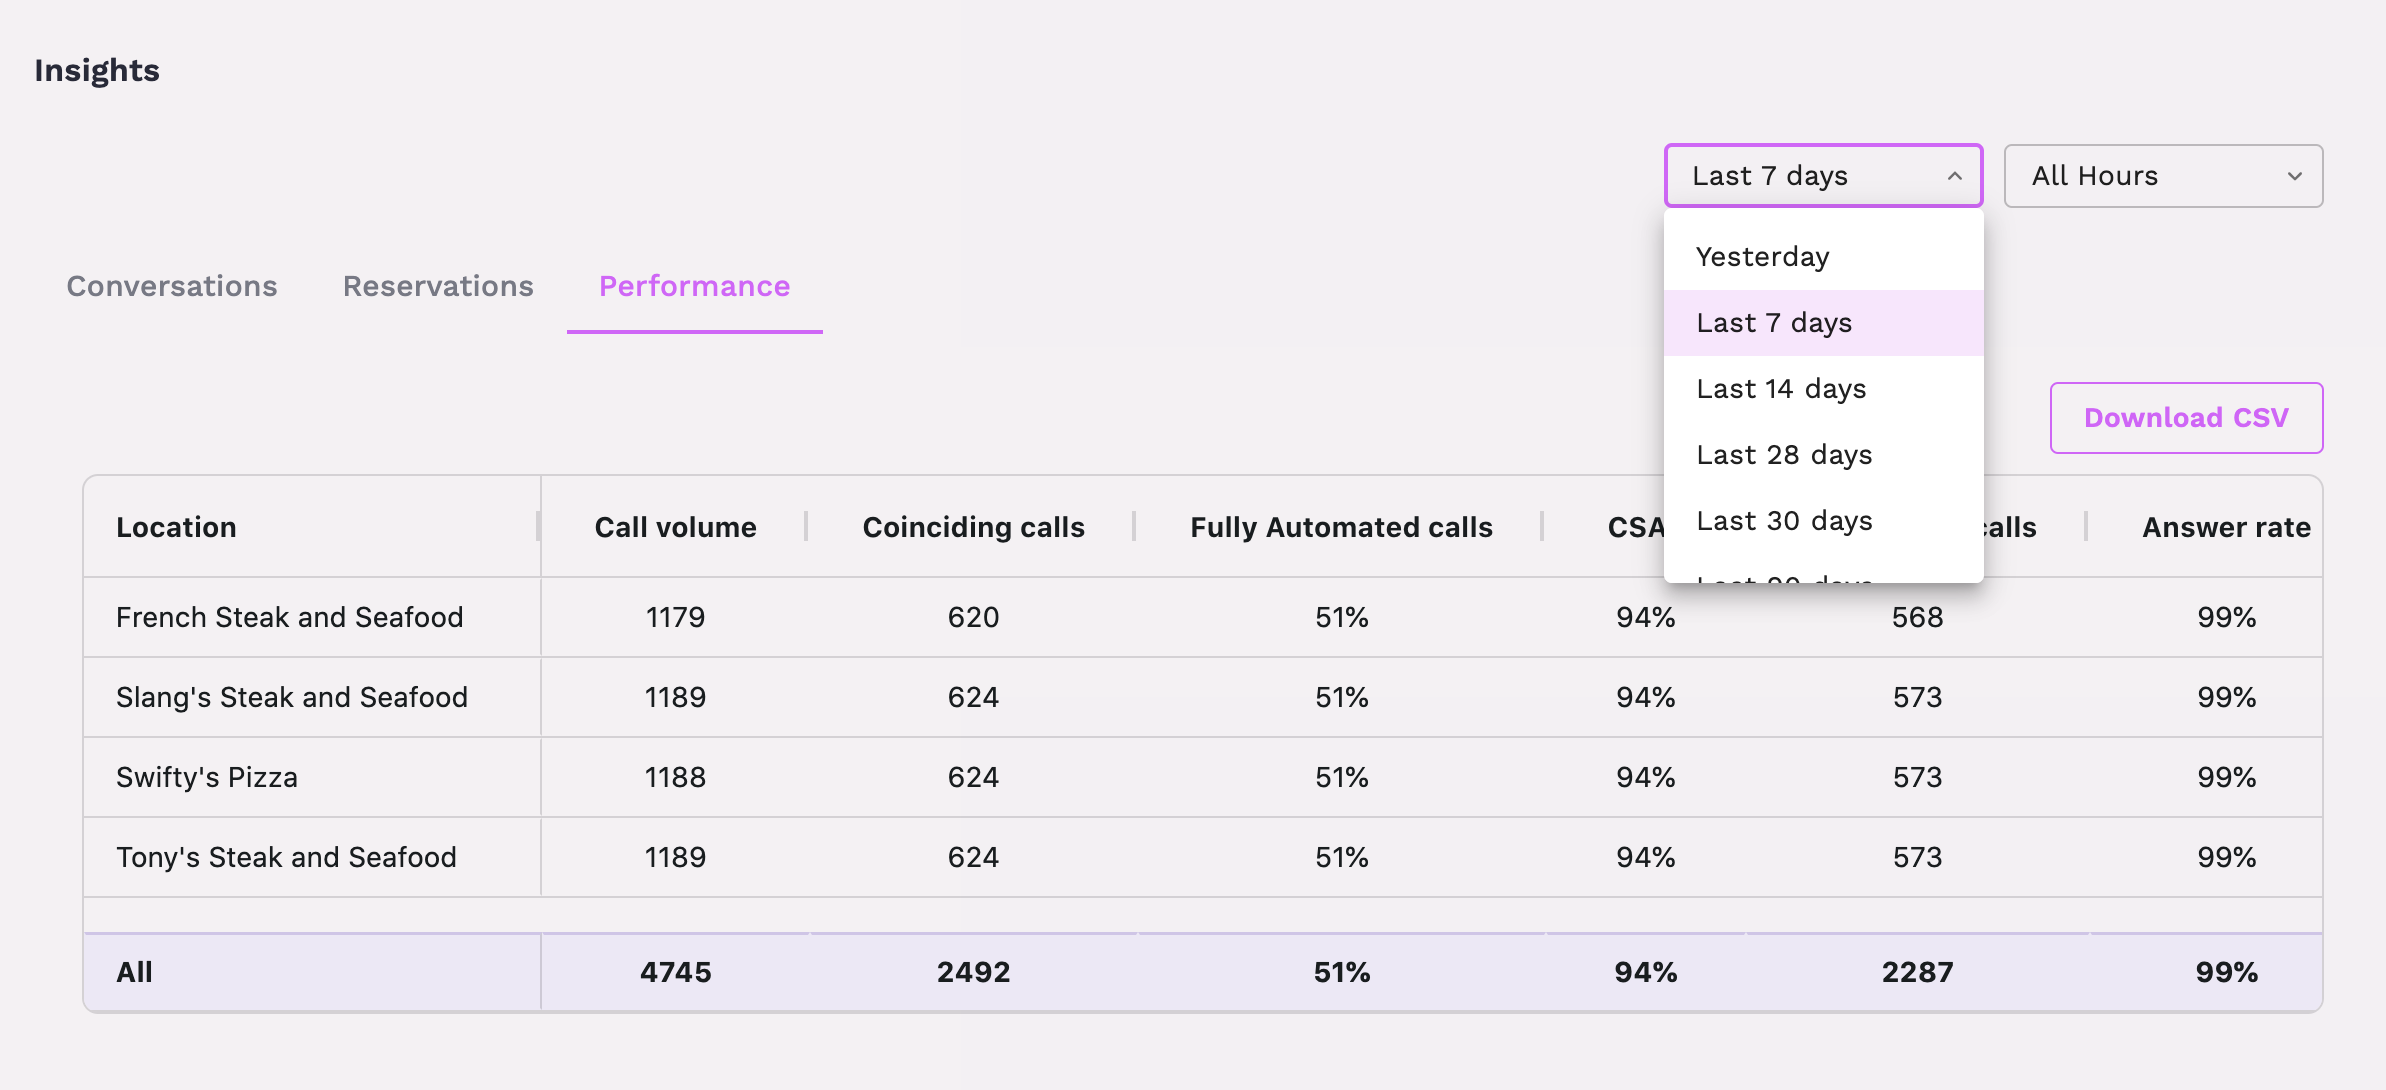
What's in the Table
What we're delivering here is a dead simple side-by-side view so you can see these stats in a consumable format across your locations live with Slang.
Most of these metrics are familiar to you already, as you can view these stats on the Conversations and Reservations Insights pages already!
Call volume
Coinciding calls
Fully Automated calls %
CSAT (Customer Satisfaction)
Transferred Calls
Answer Rate %
Bookings
Covers Booked (New!)
Cancellations
Modifications
Bookings, Covers Booked, Cancellations, and Modifications will only be populated with helpful data if you're currently enjoying our OpenTable integration.
Covers Booked is a new metric you can track with Slang's OpenTable integration!
Features
You can sort each column by clicking on the title, so you can organize the view by most calls, or by highest number of covers booked.
Click on Download CSV to export your view and share easily with teammates. The title will contain the date range filter you selected, as well as the export date for reference.
Example: Slang_table_data-LAST_7_DAYS-6_13_2025
This view is available for customers on our Premium Subscription tier.
Want to see more?
Please reach out at support@slang.ai if you have feedback on this new Insights view!